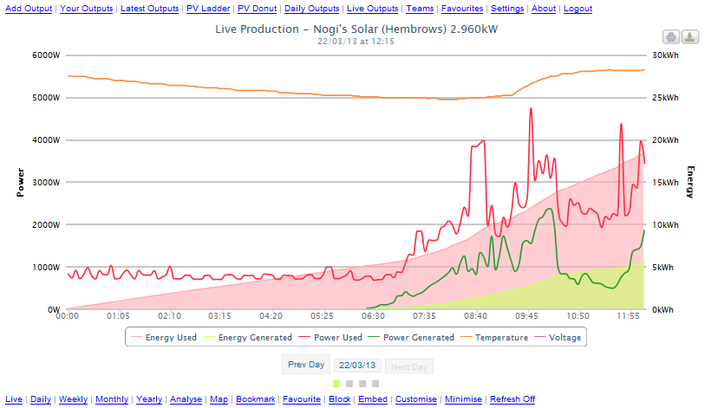
Monitoring Solar Power Panel Generation
Posted

With Solar being so popular these days, I thought I would write a quick post about how I have mine set up for monitoring solar power panel generation. There are a million ways in which people can achieve this from using Raspberry Pi’s through to having dedicated monitoring devices. This is how I’ve achieved something that works for me.
The Equipment
A number of key hardware elements make up my monitoring solution:
- SMA SB5000TL Inverter (comes with Bluetooth)
- CurrentCost EnviR kit (Display, Transmitter, RJ45 to USB cable and CT clamps)
- HP Microserver N54L
- Parani UD-100 USB Bluetooth Adapter
The EnviR is used to monitor my consumption only as the power generation is now retrieved directly from the inverter via bluetooth.
The microserver is a multi-purpose ESXi server that I already have. It’s not a dedicated box just for monitoring as it does a range of other functions as well. If I didn’t have the microserver, I would probably have gone down a Raspberry Pi route. The Parani bluetooth adapter came highly recommended as the cheaper alternatives of eBay were not powerful enough to reach my inverter from where the server is housed. A virtual host has been configured on the server to run Windows 7 64-bit and the bluetooth and EnviR are passed through to it.
Note: Don’t use the default Windows drivers for the CurrentCost EnviR unless you are wanting a world of pain with Error 10’s in device manager. Grab the latest driver from the SmartNow website and you should be fine. I found this out the hard way by letting Windows Update replace it with a newer version. Ended up having to revert to a earlier snapshot to fix it.
The Software
This is where the fun begins, the following is the list of applications that I use:
- SunnyExplorer
- pvoutput Windows Service
- PV Bean Counter (PVBC)
- mySQL
- pvoutput.org website
SunnyExplorer is the official application from SMA to connect and monitor the inverter via bluetooth. It’s a fairly easy install and configuration process under Windows.
The pvoutput service simply acts as a transfer agent between SunnyExplorer/CurrentCost EnviR and the PV data publishing site pvoutput.org. It interrogates the EnviR directly for power consumption and via SunnyExplorer for the inverter data. I am in the process of decommissioning this software as I am slowly transitioning to the PV Bean Counter application as it also supports IAMs (Individual Appliance Monitors) attached to the EnviR.
PV Bean Counter is a Windows application that pretty much does what the pvoutput service does and more. For starters, it’s not just a service so you can also display some dashboard style dial widgets on the desktop. The main reason I jumped to this application though was the support for IAMs. Along with overall power consumption, I also monitor specific appliances such as my fishtank and server rack to get an idea of what they are costing me to run 24x7. PV Bean Counter will allow me to also graph these.
Currently, PVBC is monitoring my inverter and uploading the data. For some reason I’ve been having problems with the EnviR side of things and have a couple of bugs logged with the developer. For the moment, the pvoutput windows service is sending the EnviR data to the site. The other thing that I’ve also done is swapped the SQLlite database in favour of using one of my existing mySQL database servers. Once the pre-requisite connectors were installed, this was a fairly easy process.
That’s pretty much it apart from the pvoutput.org setup. You need to sign up to the site in order to create your system(s) and get the required reference IDs for PVBC and pvoutput service. These unique IDs are so the programs know which system on the site to update with the data.
With everythiing configured correctly, pvoutput.org should start graphing the data.